Custom visualization
Aside to the true simulation state, MuJoCo provides ways to draw additional 3D geometries (geoms) onto an existing 3D scene.
In MuJoCo-rs drawing is done through MjvScene. There are two things that expose a scene for drawing custom visual-only geoms:
Drawing to a scene
To draw custom geoms to a scene inside a viewer or a renderer, applications need to alternate between calls to two methods:
MjvScene::clear_geom, which will clear all the existing geoms.
MjvScene::create_geom, which will add a new geom to the scene.
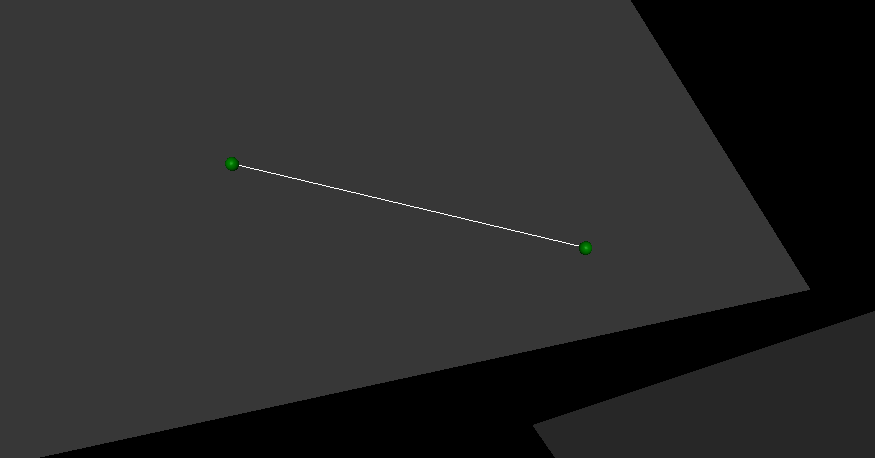
This example shows how to draw a line between two balls.
In the example we start drawing by first obtaining a mutable reference the user scene and clearing its geoms, which are otherwise preserved between syncs:
scene = viewer.user_scene_mut();  // obtain a mutable reference to the user scene. The method name mirrors the C++ viewer.
scene.clear_geom();  // clear existing geoms
We then initialize a new geom. We make it a line (MjtGeom::mjGEOM_LINE) and give it a pure white
color (Some([1.0, 1.0, 1.0, 1.0])). We leave the other fields at None as they are not needed
at this stage.
scene = viewer.user_scene_mut();  // obtain a mutable reference to the user scene. The method name mirrors the C++ viewer.
scene.clear_geom();  // clear existing geoms

let new_geom = scene.create_geom(
    MjtGeom::mjGEOM_LINE,  // type of geom to draw.
    None,  // size, ignore here as we set it below.
    None,   // position: ignore here as we set it below.
    None,   // rotational matrix: ignore here as we set it below.
    Some([1.0, 1.0, 1.0, 1.0])  // color (rgba): pure white.
);
In the above snippet, defining the fields that we’ve set to None would work, making this the final step. However, for that we would need to know their correct values. We obtain the needed values using MjvGeom::connect, which calculates the values to result in the geom pointing from one point to another.
scene = viewer.user_scene_mut();  // obtain a mutable reference to the user scene. The method name mirrors the C++ viewer.
scene.clear_geom();  // clear existing geoms

let new_geom = scene.create_geom(
    MjtGeom::mjGEOM_LINE,  // type of geom to draw.
    None,  // size, ignore here as we set it below.
    None,  // position: ignore here as we set it below.
    None,  // rotational matrix: ignore here as we set it below.
    Some([1.0, 1.0, 1.0, 1.0])  // color (rgba): pure white.
);

/* Read X, Y and Z coordinates of both balls. */
let ball1_position = ball1_joint_info.view(&data).qpos[..3]
    .try_into().unwrap();
let ball2_position = ball2_joint_info.view(&data).qpos[..3]
    .try_into().unwrap();

/* Modify the visual geom's position, orientation and length, to connect the balls */
new_geom.connect(
    0.0,            // width
    ball1_position, // from
    ball2_position  //  to
);
The following image shows the result of the above example.